Supporting cable installation in Bay of Fundy
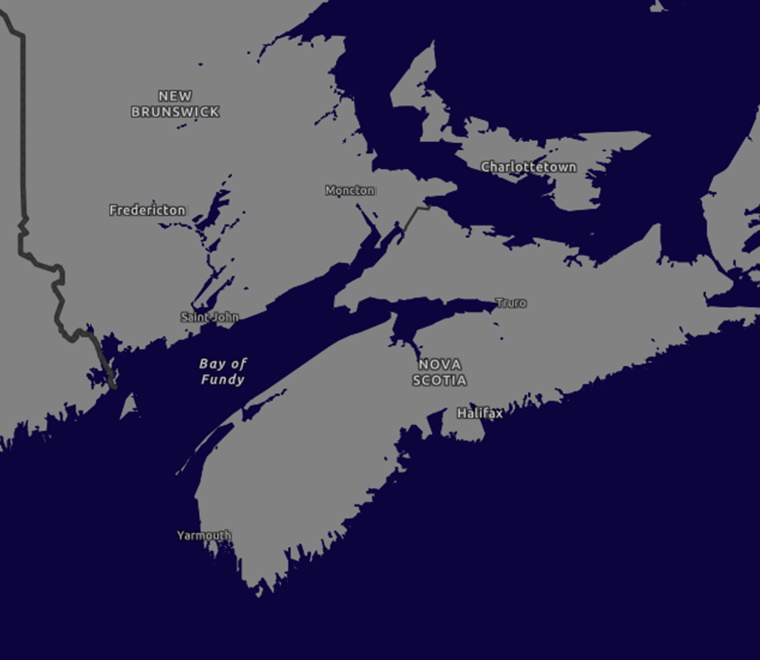
Building and validation of current and wave models to address cable route spatial variability
Learn more

To support asset management decision-making, geophysical monitoring surveys are generally undertaken to identify sediment level changes, cable exposures and seabed obstructions along the cable length.
Charts provide a visual representation along a cable or pipeline to show any changes and to assist with identification of any remedial work requirements.
With this aim in mind, ABPmer was asked to produce 30 strip charts covering along an offshore cable route using data from a recent inspection survey.
Raw data was provided to ABPmer following completion of the hydrographic survey along the cable route. We processed, classified and quality assured a seabed features dataset to meet topology standards.
Electronic charts were created at a scale of 1:1000 at A1 covering the areas of interest. Each chart was created in AutoCAD software and included predominantly four panels: bathymetry, bathymetric different image, bathymetric profile and seabed features.
All charts were delivered in DWG and PDF format.
ABPmer’s data and GIS specialists are experienced marine data handlers, developing bespoke GIS mapping and data management tools for governing bodies, the public sector and marine and coastal operators.


Building and validation of current and wave models to address cable route spatial variability
Learn more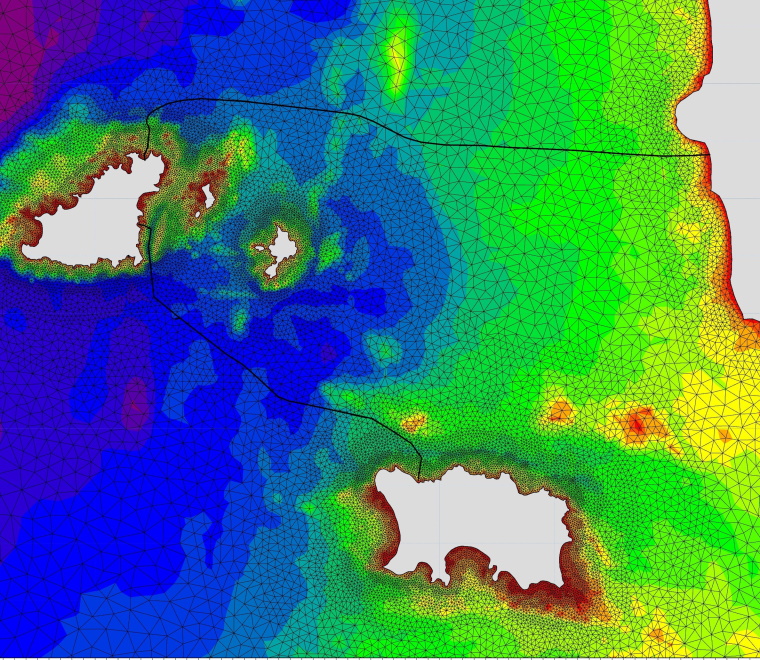
Supporting the design and installation planning of circa 100km of undersea cables
Learn more
Wave and current data and statistics to inform engineering analysis
Learn more